Our paper examining trends in acronyms in abstracts was recently published in eLife. We examined over 26 million abstracts from the PubMed database, which is easily the largest data set I’ve ever used. In this post I talk about some of the challenges and benefits of dealing with such a massive data set.
Data greed
One of the most common mistakes I see researchers — new and experienced — make is to collect too much data. A memorable example is sitting through a whole day meeting whose sole aim was to shorten a study questionnaire, only to end the day with a different but longer questionnaire.
The two imps driving this data greed are a fear of missing something vital and the ironically repeated plea that “it’s just one more question.” But big questionnaires mean small response rates, big data management issues and sludgy analyses.
It’s almost always better to answer a few questions well than answer a lot of questions badly.
Peer fear
I pride myself on being on a hypocrite, so when I started to analyse the PubMed data with 26 million available abstracts, I of course wanted to use the whole thing. The data were already collected, so I didn’t need to worry about response rates, but I knew the data management would be painful.
The imp on my shoulder whispered doubts about the peer reviewers. How much easier to be able to write in our paper, “We used all 26 million abstracts”, than writing, “We took a random sample of 1 million abstracts stratified by year.” I just imagined a peer reviewer’s horror at the 25 million “missing” abstracts.
With the imp’s help I also imagined the multitude of different sampling schemes that reviewers would suggest (“You should have stratified on journal, month, impact factor, etc…”). My firm belief (based on theory) is that any sensible sampling scheme would give similar results. Given the choice of having to explain sampling theory or using all the data, I chose the path that was easier for the reviewer and harder for me.
Data management
I badly underestimated how long this project would take. Extracting acronyms sounds like an easy task, but I had no idea of the huge variety in journal styles, even for something as standardised as an abstract.
It took around 5 days just to download the data from PubMed. I did it in two stages, a massive download of the data from PubMed into R with just a few exclusions and edits, and then a second more detailed refinement in R that took another few days.
Often after creating my “final” data set, I found a small mistake in the acronyms, one that I could have easily ignored, but I instead ended up re-running the whole data collection process again. With 26 million abstracts it only needs an error rate of 1 in 10,000 to have 2,600 errors, which just feels too big even though it’s unlikely to have any impact on broad questions such as trends over time.
I did reduce my workload by only using a fraction of the many variables available on each PubMed abstract, so it was a long data set (many rows, few columns). There’s a lot of fascinating data to mine in the PubMed database, and it’s an excellent open data source for research questions on the published literature.
Modelling
I quickly gave up on any regression models as R ran out of memory. I did use repeated smaller random samples of the data to get some trend models going, but I decided that a simple plot of the annual means was better than any model. The size of the data meant almost all the confidence intervals around the annual means were tiny and mostly invisible on any plots.
I used the “feasts” package to extract features per journal which was handy for reducing the data. We didn’t end up using these results, but they were useful for spotting data issues, in particular flagging when journals changed their style such as switching titles to all capitals.
Some benefits to big data
One benefit of using the entire PubMed data was being able to create big statistics, such as finding 1.1 million unique acronyms, which is a shocking number.
Another nice finding was that for all 26$\times$ 26$\times$ 26 = 17,576 possible combinations of three-letter acronyms using upper case letters (e.g., “WHO”), 94% of them had been used at least once. So we’ve almost exhausted our supplies of acronyms!
There was a clear pattern in the first letters of 6% of acronyms still available, as shown in the circular plot below.
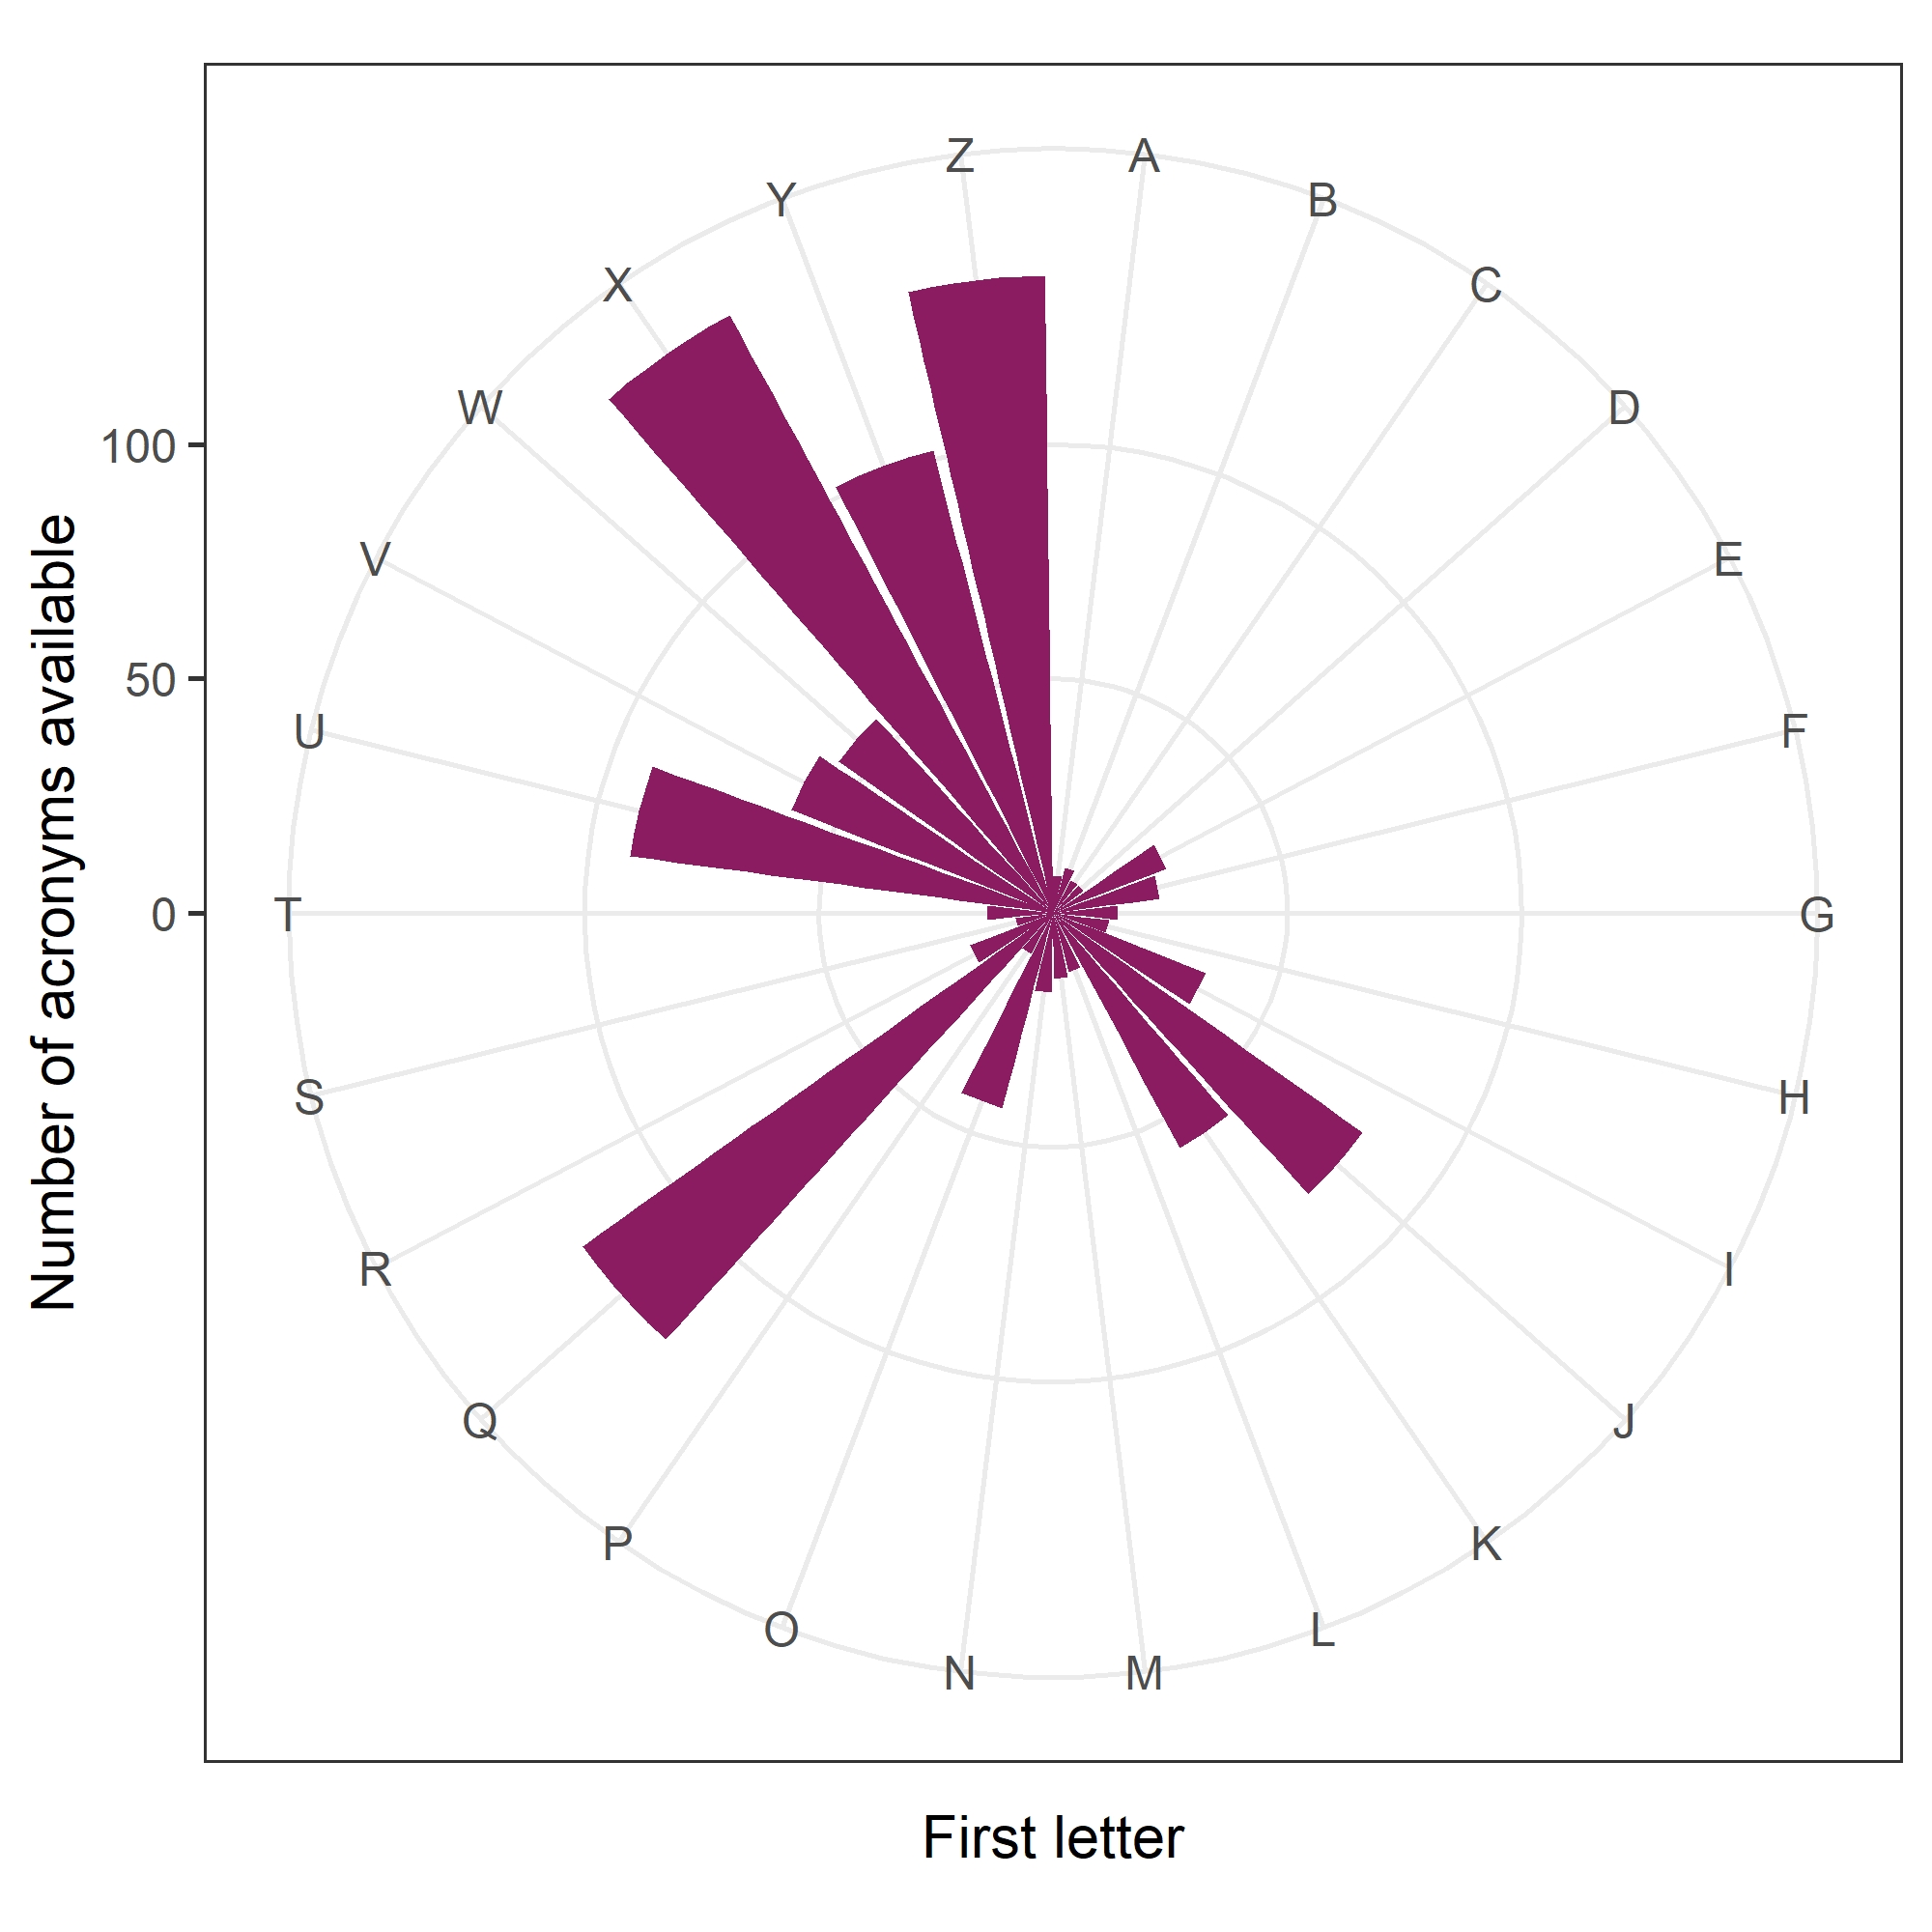
It has a remarkable similarity to the scores on Scrabble tiles:

So scientists in Queensland or Zimbabwe, or working on Zebra fish, can still make a brand new acronym.
Most scientists have to use second-hand acronyms or SHAs. But SHA could also mean superior hypophyseal arteries or side-lying hip abduction or short-stem hip arthroplasty or system of health accounts. Best to say what you actually mean.